
The Self-fulfilling Prophecy of Debt is Low-Interest Rates in Perpetuity (Maybe)
The Self-fulfilling Prophecy of Debt is Low-Interest Rates in Perpetuity (Maybe)
March 16, 2022: Making sense of a Fed Funds Rate trend
Why do we need debt?
Debt is taken out to buy an asset like a house that most people cannot acquire with their current income. It is one of the most significant engines of our modern economy.
If it is a good decision, the asset increases in value over time. The purchase of these appreciating assets from the next buyer then requires more money (higher loan amounts) paid out at greater lengths (multi-decade terms) but at lower interest rates (because the expansion of credit via the Fed forces future cycles of debt to be loaned out at lower rates than the previous cycle).
See FRED - Federal Funds Effective Rate Chart:
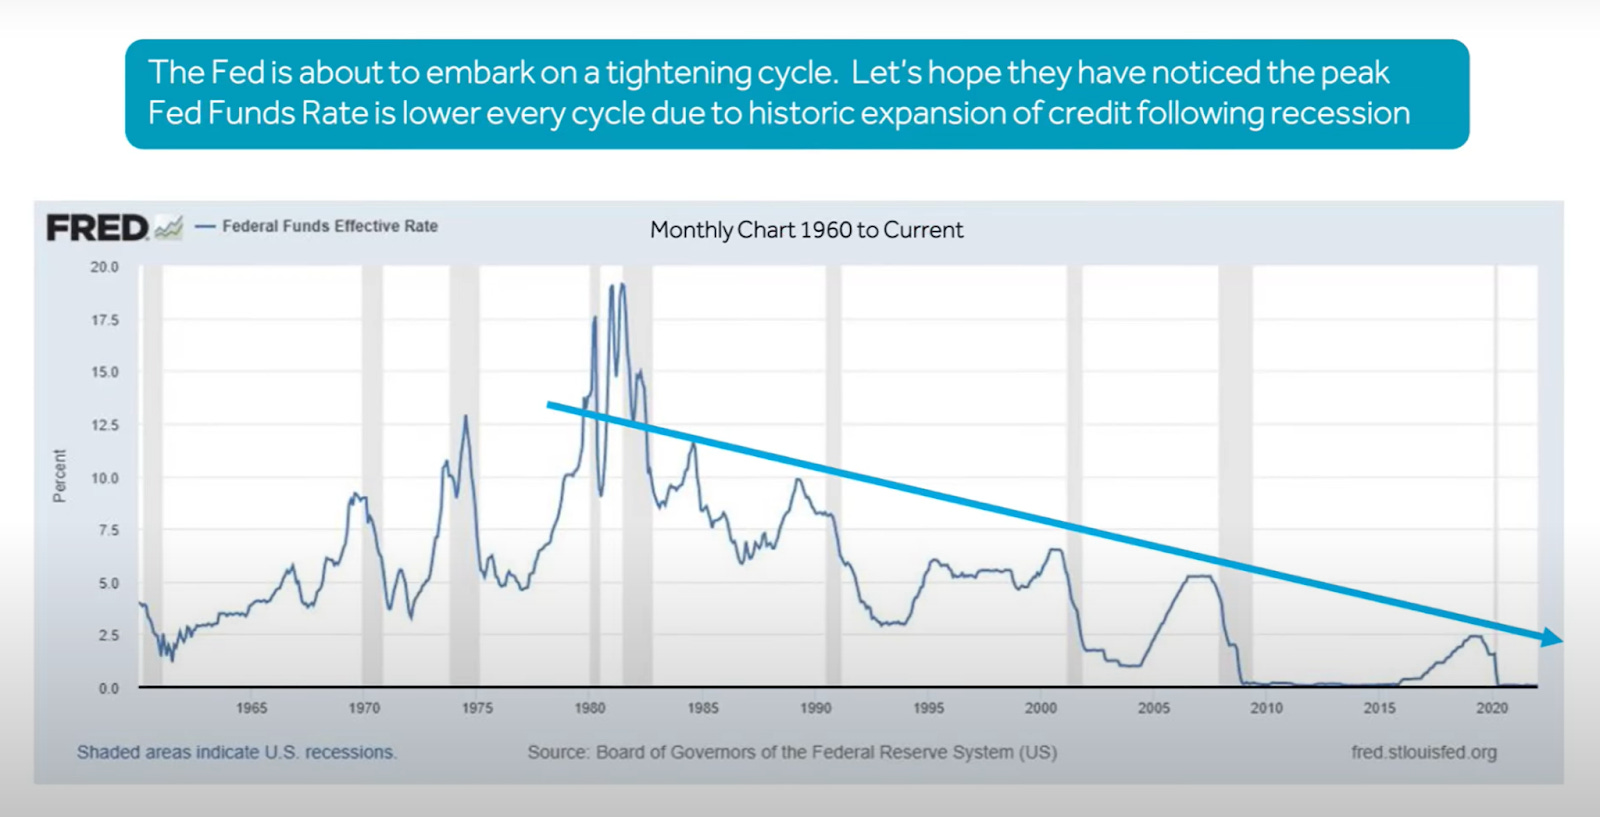
Why does each peak since 1982 of the Fed Funds Rate (FFR) resolve at a lower level than the previous peak?
FFR is a tool that the Fed uses to influence economic activity.
When it's low, money is cheap and we see more people spending. That process of spending raises valuations of assets, causes inflation, drives business investment & employment, and creates more incentive to innovate (in short: risk on!).
When it’s high, money becomes expensive, lending slows, and people tighten their belts (spend less). This results in asset selloffs, businesses engaging in cost-cutting measures like layoffs, and economic stagnation.
The result of the Fed responding to each economic crisis with exponentially more debt is that the increased size of the debt relative to the prior cycle means that it will take less of a rise in the FFR to shut down future economic activity. - Tony Dwyer
The market cannot withstand a rate that is higher than the previous peak.
Let’s put it another way: If you look at the FRED - Federal Funds Effective Rate chart above you’ll see that a gray line (recession) appears as the rate rises. This happens because debt is taken out to finance more debt, and the only way the ordinary person can afford to do that is if they’re paying lower rates.
So as rates rise, more pressure is put on the borrower, more defaults and bankruptcies occur, bank profitability drops and risks rise, market tensions rise too and the cycle of money ultimately dries up.
This is called a recession.
The Fed *must* then bring rates back down to zero (or near-zero) to induce more economic activity and bolster the stock market. They inject new money into the system to reboot the cycle.
This is why the peaks in the FFR have been trending lower with each consecutive cycle of recession → boom → recession → boom…
Note 1: The “must” is emphasized because the only ones who really say that the Fed needs to bring rates back down to zero are the Fed. They could change policy/methodology at any time. Remember that the metrics that get measured are the only ones that matter on paper (but most likely not in reality).
The sheer size of outstanding debt means that historically; over-tightening took place at a lower level than prior peak rates, which caused a credit-driven recession that took longer to recover from.
See Ned Davis Research, Inc - Real Rates Using Core PCE Chart:

Note 2: Personal consumption expenditures (PCEs) refer to a measure of household expenditures defined for a period of time. These expenditures provide a glimpse of the health of the economy. When people are spending without any hesitation, it usually means that the economy is doing well. But when they cut back, it points to problems in the overall economic picture.
Why does each recovery period take longer than the previous one?
You cannot fix debt with exponentially more debt. We keep adding to the debt level. Why do we do this (what do we use the debt for)? To buy more stuff. In theory, the biggest things we buy are supposed to appreciate in value.
Home values appreciate over time so the interest rates have to go lower to afford the higher and higher prices of that appreciating house. Each cycle of debt forces lower and lower interest rates [under current Fed policy]. - Tony Dwyer on the Compound with Josh Brown.
Even if the economy grew enough to pay back all the outstanding debt, interest rates would have to be at unimaginable numbers to make it “worthwhile” for lenders.
Note 3: From a governmental stance, we owe the majority of this debt to ourselves, the biggest player is still American Pension Plans (even though they’re in decline), Mutual Funds, and Institutions. It's a math equation (theory) and the big bad threat of this perpetual debt issue may never be realized because of the variety of timeframes, vast amount of holders, negligible amounts due, fluctuating rates, etc.
What does all of this mean?
For the Macroeconomists: Potentially, one of the Fed’s tools could soon be made obsolete because they (the Fed) will no longer be able to increase the FFR without risking economic/market collapse.
AND/OR - We could see the untethering of the current relationship between the economy and asset markets like the stock market.
AND/OR - We could end up like Europe and Japan with negative rates that consistently hamper new economic growth (aka our economy maturing).
AND/OR - We could see a drastic long-term increase in inflation because the Fed can no longer slow down red hot economic moves (and a reversal of the FFR trend) nor can it control recessions.
For investors and institutions: If your pension plan has to make 7% to pay the benefits out to your beneficiaries, and if your portfolio is 60% fixed income (which pays at most a 3% return) how can you pay that 7% out to your beneficiaries? The answer on paper: is to take more risk (crypto, private equity), rebalance your portfolio more often (churn), and/or edit your pension plan payout rules (expectations).
For the housing market: A house is an asset that delivers a benefit each year in the form of providing shelter. The value of a house is the flow of services that it provides over the coming year plus the price it could be sold for next year. We must calculate the service flow as rent even if you’re not renting out your house.
Then for a house and similar assets, the value today reflects:
The estimated rental amount of the asset over the course of 12 months
The expected next year resale value
The interest rate of existing financing (used to discount future flows)
This calculation usually means that housing values rise over time.
If a person wants to buy that house, there will be a higher price which will require a bigger level of debt to purchase which would have to be paid out longer but at lower interest levels (comparatively). These generally lower interest rates are the only way that the new person can buy the house.
Example: I can afford a $1,000,000 house at 3%, maybe even 4%, I cannot afford a $1,500,000 house at those same rates (because even at the same rates the banks would require a higher down payment and a bigger monthly payment).
So when money is thrown at the market, it gets invested, which lifts asset prices and locks up the funds…
To have economic activity then you need to actually turn over money, it needs to be spent. To facilitate trade.
There is a point where people won’t be able to afford that appreciating asset at higher rates. So the asset value blows up and collapses (uh oh, no one wants this) or interest rates go lower and lower so we can borrow more money to pay for appreciating assets.
Conclusion
All of this assumes that the Fed is the sole ruler of America’s economic and stock market environments.
It assumes that the FFR is one of those magic rates that control the rest of the financial universe (like E=MC2).
It alludes to a governmental and Fed bias to the preservation of stock market success over other metrics/measures.
There may even be plenty of evidence to suggest that the doom & gloom future that’s being predicted here is just plain wrong.
Disclaimer: This has been a side project of mine for well over a year. I do not believe that this is even close to the full answer nor do I believe it’s perfect. But I do think that I’ve improved my own understanding of the Fed and one of its prominent tools (FFR) for influencing American markets. I hope this serves as a primer for myself and others, and it shall be fun to look back on in 30~40 years from now to see just how wrong I am.
I am also including a list of questions I have about the findings above, I will continue to work on this piece (or make a follow-up) in the months & years to come.
Further Questions
For the FFR Chart:
What was the Fed Funds Rate before 1960? Have the calculations for the FFR ever changed?
What was Fed policy history like? How does it differ now? What are some common disagreements among staffers, economists, bankers… within the Fed right now about the economy and other asset markets?
What about other factors that caused the recessions that stopped the FFR from going above its previous peak? Could this chart be more of a “correlation ≠ causation” chart and we just haven’t seen enough to know otherwise (yet)?
For the PCE Chart:
Do 4 times make a trend?
From 1960 to 1982 the rate environment was trending upward and inflation was rampant. Could the Fed have over-corrected in its policy adjustments post-1982?
Do we think that the broader economic/market situation could have changed between the 80s and now which warrants a new way of doing things?
General:
Are all recessions made equal? Are they all treated equally? (Depending on the answers to those two questions, should they be?)
Could we have had it all wrong?
Is it the change from loosening to tightening (and vice versa) that causes the markets to react violently (both upside/downside) OR is it a specific level that’s the cause? Halftime Report, March 2022.